
Paper Explainer: An Update on the LHC Monojet Excess
/A few months ago, I wrote a paper with some of my fellow physicists at Rutgers: a graduate student Pouya Asadi, postdocs Anthony DiFranzo and Angelo Monteux (now a postdoc at UC Irvine), and fellow professor David Shih. We had developed a new technique to sift through data from the two general purpose LHC experiments (ATLAS and CMS) to look for anomalies that could be the sign of new physics. While that paper was primarily about the data-mining technique in general, we also identified one possible excess that had escaped previous detection. We dubbed this the “mono-jet excess” since it was mainly found in LHC events with one jet of energy and significant amounts of missing momentum (characteristic of an energetic particle that doesn’t register in the LHC detectors).
That excess we had found both in CMS and ATLAS data, with greater statistical significance in the CMS results than ATLAS. We were interested in keeping an eye on the anomalous result, and so when ATLAS published a new search, which used the same data as previously, but with different selection criteria, we looked to see if the anomaly was still there. It was, and so we wrote a short letter discussing what we found, which is what I'll be describing here.
To be clear, we are not claiming that the excess of events we have identified in the CMS and ATLAS data is evidence of new physics. That requires a great deal of statistical significance, which we are far from. Instead what we have found is an anomaly: more collisions at the LHC seem to have resulted in events with a particular set of kinematic features than we would expect from the Standard Model alone. As I’ll describe, we estimate the data favors new physics only at the $\sim 2.5\sigma$ level, not the $5\sigma$ required to claim discovery of new physics. Such statistical preference for new physics could be wrong, and should be wrong about one time out of 80. That’s far too low of odds for us to get too excited about it. Normally, the correct response to such an anomaly is to wait for more data, which should increase the statistical preference if it is indeed new physics. However, as I’ll describe, this particular anomaly requires additional work by the experiments to increase the significance, not just new data. In our letter, we talk about what would need to be done.

First, the data. As I said, in our previous paper, we identified an anomalous number of events in CMS data. The kinematic features of these events (number of particles in the LHC event, their energy and distribution) were not consistent with the “standard” types of new physics (supersymmetry, most notably) that we usually look for. This is why it had escaped attention before our data mining technique was developed. We did some model-building, and found that a sort of odd model of new physics would be required to fit the data: a new massive strongly interacting particle that was produced singly, then decaying back to a quark and another massive new particle that was invisible to the CMS detector (that is, was not electrically charged or interacting via the strong nuclear force). Since we (unimaginatively) named the heavy particle the $phi$, we called this the “mono-$phi$” model.
The anomaly was seen mostly in CMS data ($2.5\sigma$), but there was some hint of it in ATLAS ($\sim1\sigma$). However, after we published our paper, a new analysis of ATLAS data came out. As theorists, we don’t get to dig into ATLAS and CMS data directly: all we can do is reinterpret what the experiments put out. This new analysis gave us different information than we had previously, and allowed us to look in the ATLAS data more carefully for our mono-$phi$ events. This new search also had our excess, and at greater significance than seen previously.

I’m showing here the statistical preference for our model of new physics as found in a number of CMS and ATLAS searches. The horizontal axis is signal strength for our model. Zero would be no new physics. Each search prefers some value of the signal strength; the central value is the best fit, and the error bars tell you how certain we are (statistically) about that preference. The region inside the red error bars is $1\sigma$, black $2\sigma$, and $3\sigma$ (these are all “local” significances, as I’ll describe shortly). CMS036 and CMS033 are two searches that had seen some hints previously (the numbers are our shorthand for the codes the experiments use to identify these results). CMS048 is a search from CMS that does not see the anomaly. ATLAS022 was the previously available search, and ATLAS060 is the new one that we added for this letter.

Each search from CMS or ATLAS uses some events that are also used in the other searches; so you can’t just add CMS033 and CMS036 and CMS040 and ATLAS022 and ATLAS060 to get a single number that tells you how much all the data prefers new physics. Or, the experiments could, but we theorists cannot, we lack the full information and we’d be “double counting” events. But we can say that CMS and ATLAS data is completely distinct, and so we can add together one search from CMS and one search from ATLAS. We chose CMS036 and ATLAS060, because these are the two that have the most preference for new physics. As you can see in the plot of statistical preference, the combination prefers new physics at above the $3\sigma$ level (in fact it is $3.3\sigma$) for the best possible choice of parameters in our model. Here’s a plot of the statistical preference as we vary those parameters: the masses of the two new particles, the colored $\phi$ and the invisible $\psi$.
This is “local” significance; which just asks “how unlikely is it that these experiments see an anomaly in this region of parameter space?” but doesn’t address the question “how unlikely is it for the experiments to see an anomaly anywhere?” For that, you want “global” significance. We estimate that, within the context of our mono-$\phi$ model, the global significance is $2.5\sigma$, corresponding to this anomaly coming about by pure chance about 1.3% of the time (or 1 in 80). Not bad, but far from the $5\sigma$ evidence we need to really claim discovery. So, how do we get to that level of confidence?
Normally, we think that the statistical significance grows with data: collect 4 times the amount of data, and roughly the statistical significance (if the signal is real) should double in sigma. This assumes that your signal is “statistics limited.” Let me explain what that means with a simple example. Imagine that, given a certain number of LHC collisions, you expect to see 100 events from “normal” physics. You are interested in finding evidence of “new” physics that also adds events which look identical to this "normal" physics. So if you see more than 100 events, that means you have new physics, right?
Well, it’s not that simple. 100 events is the most likely result. If you collect that amount of data, sometimes you’ll see exactly 100 events. But sometimes, due to random fluctuations, you’ll see 102 events, or 80, or 116 or some other number, all due to the normal “background” physics. How to tell if you’re seeing something new? Well, if we expect the average number of such events to be $N$ (here $N = 100$), then we expect fluctuations around that expectation to go like $\sqrt{N}=10$. This is the statistical error.
So seeing between 90 and 110 events is the $1\sigma$ expectation, between 80 and 120 is the $2\sigma$ and so on. So if we want to measure new physics at the $5\sigma$ level, we can only do that if the new physics contributes (on average) 50 new events (that is, we see 150 events and expected only 100 from background). That means we can only be sure of new physics at the $5\sigma$ level if it contributes 1 event for every 2 background. Not great, right?
But let’s say that we just wait to collect more data: we let the LHC collide more protons until the background expectation for this process is 400 events (4 times the previous data set). Now the statistical error is $\sqrt{400} = 20$. A $5\sigma$ fluctuation is then 100 events. So if we see 500 events when we expected 400, that's $5\sigma$ evidence. That means we can find new physics if it contributed 1 event for every 4 background, rather than 1 out of every 2. Improvement!
That’s the standard story for statistical searches: as you collect more data, the statistical errors decrease as a fraction of the total (specifically, the fractional error decreases as $1/\sqrt{N}$. So you just wait, and eventually you can see some small signal over a large background. But that assumes you know exactly how many background events you should expect. What if you’re wrong? What if you have a systematic error in your understanding of the background. Going back to the previous example, if we were only certain of the background expectation to 10%, then waiting till we expected 400 events, we’d still have an error of 40 events, not the 20 that pure statistical errors would predict. Which type of error matters more depends on whether you are statistics dominated (you understand your backgrounds really well, you just don’t have enough data to be confident that big deviations aren’t just due to a small sample) or systematics dominated (you aren’t sure in your background prediction).

In this particular case, the experiments are systematics dominated. The signal is “a bunch of energy in a single jet, and something we can’t see in the detector.” That’s relatively easy to get wrong, thus the systematic uncertainty in the number of Standard Model events in to the background. There are actually lots of events contributing to the anomaly (seen here in one particular distribution for CMS036 and ATLAS060). For the searches we are interested in, the statistical errors right now are at the 0.3% level, and the systematic errors are at the 1-2% level. That is, we are systematics dominated. Which means that, if we just collect more data, we’d still expect the significance of the signal to be $\sim 2.5\sigma$. It could shrink with more data, of course, which would indicate this isn’t new physics, but if it stayed the same that’d be hard to evaluate.
So what to do? To determine if what we’re seeing is “real” or just a systematic error in background predictions, we need to make some prediction and then test it. We as theorists can’t really do the testing: we lack full information about each event as seen by CMS and ATLAS, so we can’t delve that deep into their data and try new techniques to see what happens. But we can generate fake LHC events and see what kinematic handles might be useful to split signal away from background. That is, we can predict what the experimentalists should see if this anomaly is due to new physics. So that’s what we did: generating mock LHC data coming from the mono-$\phi$ model and the primary sources of Standard Model events that make up our backgrounds, and then looking for a way to distinguish the two that the experimentalists hadn't already tried.
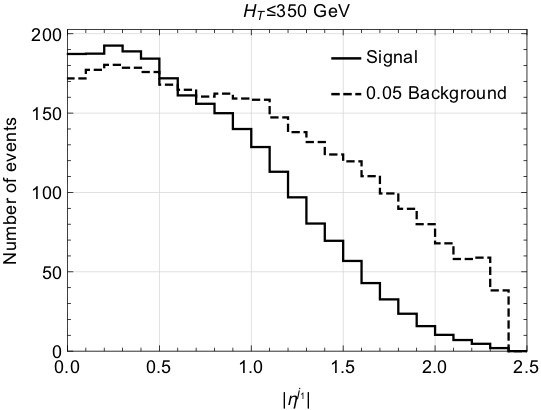
What we found was the the interesting signal tended to be more “central” than the background. The LHC detectors are basically big cylinders, with the beams of the LHC protons coming in at the top and bottom. When a collision occurs, energy sprays out mostly towards the rounded side of the cylinder, not the ends. Mostly. Energy that tends to go to the ends is called “forward” (we don’t distinguish the two ends at the LHC, so there’s no generic “backwards”) and energy that goes to the center of the cylinder is “central.” The variable that tells you the centrality is called $\eta$ (the “pseudo-rapidity.”) Here I’m showing the distribution of signal (solid) and background (dotted) in $\eta$. By placing an additional selection criteria on the $\eta$ of the jet in the events that CMS036 and ATLAS060 are already using, we believe it is possible to increase the signal compared to the background by a factor of around 1.5. If this can be done without increasing the systematic errors (a difficult problem, but one that we hope the CMS and ATLAS experimentalists can solve), than the statistical preference for signal from each search should go up by a similar factor. This might not be enough to drag us over the magic $5\sigma$ line, but at least it would give us some additional hint of whether this anomaly we identified is really something new, or just another mirage in the data.
Previous experience tells us that $2.5-3\sigma$ anomalies in LHC data will disappear. So the safe money is that this one will go away as well. But it's worth testing out, because past results are no guarantee of the future. There is new physics out there, we know that much. We don't know if it will appear in the LHC data, but if it does, we need to make sure we don't miss it.