
Diphotons at 750 GeV
/Yesterday was the first big data release from the LHC’s Run-II, where protons were collided with a total energy of 13 TeV (usually written as $\sqrt{s} = 13$ TeV by particle physicists. This is about 13000 times the energy contained in the mass of a proton). This is a major upgrade from Run-I, where $\sqrt{s}$ was only 8 TeV. That lower energy was forced upon us by problems with the superconducting magnets that bend the protons and keep them circulating on the 27 km ring: higher energies require stronger magnetic fields to keep the protons on the ring (in the “beam-pipe”), and unforeseen problems meant that the physicists and engineers responsible for the LHC operators could not guarantee that such high energies wouldn’t result in a machine-damaging magnet quench like the one that took the LHC offline in 2010. After Run-I’s successful completion (finding the Higgs on July 4, 2012, i.e. Higgsmas), the LHC magnets were refurbished, new safety mechanisms put in place, and the machine-physicists were confident that we’d be ok running at 13 TeV (bringing us closer to the nominal $\sqrt{s}$ of the LHC, which was originally stated to be 14 TeV).
Run-II concluded this last fall, successfully, though with much less data than Run-I. I’ve talked about how collider physicists talk about the amount of data before, when I wrote about cross sections and the units known as “barns” (and the units picobarns — pb — and femtobarns — fb — which are more relevant for the LHC today). Short version, a picobarn or femtobarn is a measure of the “size” of the region that two protons need to “hit” in order to produce some particular final state: either well understood particles from the Standard Model, or something new, like the Higgs we found with a mass at 125 GeV. Larger cross sections mean something is easier to produce, smaller is harder.
We measure the rate of data collection then in the strange units of “inverse cross section” so fb$^{-1}$. This is so that, when given the “luminosity” ${\cal L}$ of the LHC (number of protons passing through the collision points) in inverse femtobarns, if I also know the cross section $\sigma$ of the process I’m interested in (in femtobarns), I can get the number of events that should have occurred just by multiplying the two: \[ N = {\cal L} \times \sigma. \] Nice and easy.
Run-I collected about 20 fb$^{-1}$ of data in both multipurpose experiments: CMS and ATLAS. Run-II collected 3.2 fb$^{-1}$ in ATLAS and 2.6 fb$^{-1}$ at CMS. Two things to note: first, this is a lot less than we did in Run-I. There were a few more growing pains this time around, which older physicists tell me is far more common with a new machine than the relatively smooth sailing we had in Run-I. We all got so spoiled by that experience that there was a low-level freak-out in some quarters when reality interjected itself this time around. Second, ATLAS collected more data than CMS. Again, last time everything worked perfectly, this time CMS had some problems that made it a bit harder for them to take data. Unfortunate, and terribly concerning if you expect the most complicated machines in history to work like off-the-shelf Macbooks, but not that big a deal. We’ll be running these machines for another decade or two at least, and the bugs will get worked out.
Run-I collected about 20 fb$^{-1}$ of data in both multipurpose experiments: CMS and ATLAS. Run-II collected 3.2 fb$^{-1}$ in ATLAS and 2.6 fb$^{-1}$ at CMS. Two things to note: first, this is a lot less than we did in Run-I. There were a few more growing pains this time around, which older physicists tell me is far more common with a new machine than the relatively smooth sailing we had in Run-I. We all got so spoiled by that experience that there was a low-level freak-out in some quarters when reality interjected itself this time around. Second, ATLAS collected more data than CMS. Again, last time everything worked perfectly, this time CMS had some problems that made it a bit harder for them to take data. Unfortunate, and terribly concerning if you expect the most complicated machines in history to work like off-the-shelf Macbooks, but not that big a deal. We’ll be running these machines for another decade or two at least, and the bugs will get worked out.
So, what did we find? There are of course many physics searches one can do at the LHC, and we’ve only seen the first ones, which tend to be ones that hit some sweet spot of importance and straightforwardness to be finished in time for this first data release. Not to say these analyses are easy or other searches are less important, just that they are easier than some of the ones that will come later and/or considered the most likely places to look for new physics. You actually have to keep in mind the number of analyses that will be done when looking at unusual results. As I’ll talk about, in any search, there’s something called the “look-elsewhere effect,” which basically says that if you can look for new physics in 1000 places in one analysis, you may have 1000 chances of seeing something statistically unusual, so you have to take that into account when saying something is statistically relevant. With 1000’s of searches, we have some sort of meta-look-elsewhere effect: there are many places that could have unusual results pop-up.
The search that everyone has been rumor-mongering about for the last few weeks is the analysis where you look for two high-energy photons in the detectors. Both CMS and ATLAS do this analysis, and it’s very “clean,” as photons at high energies can be relatively easily understood, and their energies and momenta reconstructed with small errors by the experiments. This is in contrast to some other analyses where you might have real concerns that slight mis-calibrations of your detector could lead to big errors in your conclusions. Experimentalists take those mis-calibration errors into account of course, but not having to worry about them is much nicer.
This final state is actually where we found some of the first evidence for the Higgs at 125 GeV, so let me use that as an example to help you understand what’s going and the playing field for the discussion.
To look for a new particle decaying to two photons, what you do is take events with two photons and then construct their “invariant mass.” Individual photons have zero mass (which is why they move at the speed of light). However, when you have two (or more) particles, you can add their momentum and energy in a particular way to get this invariant mass (it is invariant because it will be the same no matter how you as the measurer are moving relative to the photons — it is relativistically invariant). For those playing along at home the invariant mass is \[ m_{\gamma\gamma} = (E_1 + E_1)^2 - |\vec{p}_1 +\vec{p}_2|^2 \] where $E_1$ and $E_2$ are the energies of the two photons and $\vec{p}_1$ and $\vec{p}_2$ are their momenta. If those two photons came from the decay of a single particle, this invariant mass will be the same as the mass of that particle.
This is why diphoton events are such a great place to look for the Higgs. The Higgs only rarely decays into two photons, the “branching ratio” of 125 GeV Higgses into two photons is only about 0.23%. Which is to say if you produce 1000 Higgses at the LHC, only 2 or so will decay into a photon pair. However, those pairs of photons will have a beautifully clean invariant mass, which show up over the background.
Because all searches at the LHC are looking for some rare new physics events on a background of many other “boring” physics events. For example, many processes in the Standard Model of particle physics can result in pairs of photons with an invariant mass at 125 GeV. However, if you produce a few extra Higgses, and they decay to a photon pair with this invariant mass, then you can statistically determine that you’re getting something new. It will appear as a peak in the distribution of the diphoton invariant mass. So such searches are often called “bump hunts.”

It’s really useful to see an example of what this looks like. So let’s look at the results of the ATLAS search for the 125 GeV Higgs in Run-I. The animated gif here shows the distribution of photons in $m_{\gamma\gamma}$, as a function of time (note how the luminosity increases as the gif runs). As you collect more data, you see the background distribution take shape: a gently falling number of events, decreasing as you go to higher $m_{\gamma\gamma}$. This sort of falling spectrum is pretty typical of Standard Model processes, and is a result of it just being more difficult to find the larger amounts of energy in the colliding protons to produce two high-energy photons which can combine to give a large invariant mass (roughly, you might estimate that each photon gets approximately $m_{\gamma\gamma}/2$ of energy).
When a new particle is produced, in this case the Higgs, which can decay to photon pairs, that sticks up over the background, localized to one or two “bins” of invariant mass. The more data, the more statistically significant this excess becomes. This is due to how random numbers work. If you have a background which should result in $B$ events, then you can randomly expect fluctuations in the number of events seen which are about $\sqrt{B}$. So if you have something that should occur 50 times, you wouldn’t be too surprised if you see anywhere between $50+\sqrt{50}= 57$ or $50-\sqrt{50} = 43$ events. Anything in that range is a “$1\sigma$’’ fluctuation, which occurs about 68% of the time. Seeing fluctuations of $50\pm2\sqrt{50}$ events would be a $2\sigma$ fluctuation, which is rarer, we expect that to occur in less than 10% of the cases.
Now, if instead of having 50 events, I expect to see 500 (say I’ve waited till I have 10 times as much data). Then I wouldn’t be too surprised to see $500+\sqrt{500} = 522$ events. But even though that fluctuation is numerically larger than the $1\sigma$ fluctuation for 50 events, it is fractionally smaller, as \[ \frac{\sqrt{500}}{500} = 4.5\% < \frac{\sqrt{50}}{50} = 14\%. \] So by waiting for more data, we can expect that random fluctuations sort of wash out, and any deviation above that becomes visible. Notice that the fractional size of a random fluctuation of background goes as $1/\sqrt{B}$.
Thus, you’ll hear people talk about $S/\sqrt{B}$, where we compare the number of events in some signal $S$ that we’re looking for to the size of random fluctuation of the background. Larger $S/\sqrt{B}$ is better. Waiting for more data (via more luminosity) helps this ratio, as the number of signal and background events both go like ${\cal L}$, so the ratio goes like $\sqrt{{\cal L}}$, which only increases with time.
Real statistics done by the experiments are more sophisticated than this, but it’s a good rule of thumb. Look at the Higgs discovery. The bump gets more obvious by eye, and at the end of the data collection, there are maybe 2500 background events in the bins around 125 GeV, and 150 signal events. Then, this ratio would be [ \frac{150}{\sqrt{2500} = 3. ] Which is pretty good ($\sim 3\sigma$). Add in more detailed simulation and the other discovery channel ($ZZ$) and you can get to the $5\sigma$ gold standard.
For completeness I’ll mention that what I’ve been talking about here is “statistical error.” Systematic errors are errors in modeling or predicting your background which don’t necessarily have fluctuations that decrease fractionally in this nice way. So in addition to having large $S/\sqrt{B}$, you’d like to have signal regions that have large $S/B$: just way more signal events than background. But this isn’t always easy to separate, since the LHC doesn’t give us nice little flags for each event that say “new physics” and “old physics.”
There is also the question of which bins to look in. If no one told you to look in the 125 GeV bin beforehand, then just because you have a large fluctuation in the number of events doesn’t mean something necessarily special is going on. $3\sigma$ fluctuations are expected to occur just due to random chance 0.3% of the time. So that’s pretty unlikely. But how many bins have I looked at here? Dozens? Hundreds? Then, remember, if we see a fluctuation anywhere we’ll start talking about it. So this is where the look-elsewhere effect comes in: you have to temper your expectations by saying, yes, this will only occur 0.3% of the time, but if I’ve done 100 searches, then I’ll expect to see this unusual result somewhere about a quarter of the time. If I do a 1000 searches, the probability of seeing this sort of result somewhere becomes 95%. We call the deviation without considering look-elsewhere the “local” significance, and with look-elsewhere we refer to “global” significance.
This is why it is nice to have two experiments. If one experiment sees something in a particular final state (diphotons), and at a particular mass, and the other experiment sees something in the same place, then you have sort of treat the 2nd result as not suffering from the look-elsewhere effect. Doing the statistics rigorously is tricky, but when the rumors started swirling that both ATLAS and CMS were seeing something at 750 GeV in diphotons, we all started getting excited.
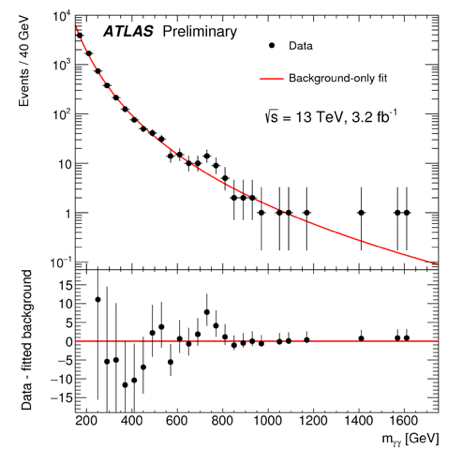
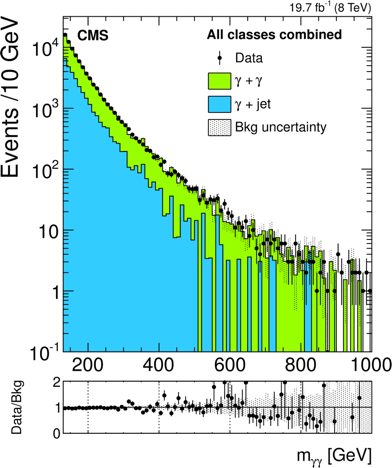
OK, so enough background, let’s look at the data. I’m showing here the raw number of events that ATLAS sees in their diphoton analysis, and then that CMS sees in their equivalent. Looking first at ATLAS, you can see by eye a uptick around 750 GeV, corresponding to a $3.6\sigma$ deviation. Adding look-elsewhere brings that down to $2.0\sigma$. CMS has a deviation at 760 GeV with a $2.6\sigma$ local and $1.2\sigma$ global significance.
Keep in mind that we aren’t talking about too many events here. I estimate that the two mass bins driving ATLAS’s excess have 23 events total, and the background expectation was 10. So only 13 additional photons. CMS saw about 9 total photons, and expected to see 4, so 5 extra. Such is the fate of small luminosities.

Another thing: ATLAS sees two bins as having more photons than expected. That makes their data prefer a “wide” particle. In particle physics, a particle that doesn’t live that long has a bit of fuzziness around the value of it’s mass (this is the Heisenberg uncertainty principle: if the particle doesn’t live long, the Universe can’t measure its mass precisely). We refer to this as the “width” of the particle, since if we trace out the $m_{\gamma\gamma}$ distribution of such decaying particles, the spectrum of photons stretches over many values of $m_{\gamma\gamma}$: the particle is wide on our plots.
Well behaved new particles (like the 125 GeV Higgs) should have widths that are only a fraction of percent of their masses. ATLAS prefers a particle that has a width of 45 GeV, or 45/750=6% of the mass. That’s unusual. CMS doesn’t prefer such a wide particle, so that’s not great. Though, you may argue, CMS has fewer events and lower statistical significance, so maybe they just got unlucky. Regardless, there is some tension between the two results.
Now you can ask: should we have seen this already? ATLAS and CMS looked for diphoton events before, in the 8 TeV Run-I data set. Now, the whole point of going to higher energy in our colliders is to make it easier to produce heavy new particles. The heavier the particle, the more energy you need to make it. The relevant figure of merit here is a factor of 5: which is to say, for a particle at 750 GeV, it is 5 times easier to make it at Run-II as it would be in Run-I.
Now, a bit of numerology. ATLAS has 3.2 fb$^{-1}$ of data at 13 TeV, and had 20 fb$^{-1}$ at 8 TeV. That factor of 5 means that they have the equivalent of 16 fb$^{-1}$ in Run-II if they wanted to compare to their old results at 750 GeV. So it’s not impossible for them to not have seen anything, but it’s not necessarily crazy.
Indeed, I find that there is a bit of tension between the null results from the previous analyses of CMS and ATLAS and the new ones. Here I’m showing the raw counts of diphotons from CMS from their Run-I analysis, and then also the ATLAS equivalent. In both cases, they are sensitive to small number of events in the relevant bin. Indeed, they see none. I roughly estimate that they should have seen double the (few) events that they are claiming. This matches with what was said by ATLAS, which admits that their new results are in $\sim2\sigma$ tension with their old results. Not a complete deal-breaker, but something to watch out for.

But if it is new physics, what would it be?
Since this is diphotons, and we found the Higgs in diphotons, the first thing you’d want to say is that this is a new heavy Higgs. We actually expect heavy Higgses in many new physics scenarios, but if this is real, it is unlikely to be a new Higgs. The problem is that Higgses want to decay to the heaviest particles around, which means top quark pairs. Our 125 GeV Higgs doesn’t decay to tops, but only because the tops are too heavy, so the Higgs doesn’t have enough energy to decay that way. Even so, our Higgs only decays to photon pairs 0.23% of the time. A heavy Higgs at 750 GeV would decay to photons orders of magnitude less often than that.
You can, of course, play new tricks to get it to work. You introduce new particles which allow the 750 GeV Higgs-ish particle to couple to photons a lot more than we’d expect, yet are too heavy for the particle to decay into them. To make this new particle as “wide” as we see it, you can introduce new “non-perturbative” couplings, making the new particle sort of like a super-heavy version of the particles known as pions, which are formed via the strong nuclear force interaction of a quark/antiquark pair. Even so, you have a bit of trouble getting the decay to photons right, but it can be made to work out, I gather.
Another trick you can pull to try to avoid the tension between the old and new data is to make the responsible physics heavier than 750 GeV. The heavier the particles causing this, the bigger the gain you get in the 13 TeV data. So, maybe what we’re seeing is a new particle at 1510 GeV decaying into two 750 GeV particles, one of which goes to photons, and the other decays to invisible particles (maybe our missing dark matter!). We are told that the handful of events driving these bumps are “clean,” without a lot of other visible particles hanging around, but if you work out the masses of the other particle (the one not decaying to photons) correctly, you might be able to hide it.
So I’m skeptical, and wishing for more data. There are some suspicious tensions with previous results, but it’s certainly not clearly wrong, and its definitely the most intriguing sign of something new since the Higgs discovery. Unfortunately, we’ll have to wait at least a year to get more data to directly speak to this anomaly. It will be a difficult wait.